
A timeframe is the duration represented by a single candle. On an H1 chart, one candle = 1 hour of price movement.
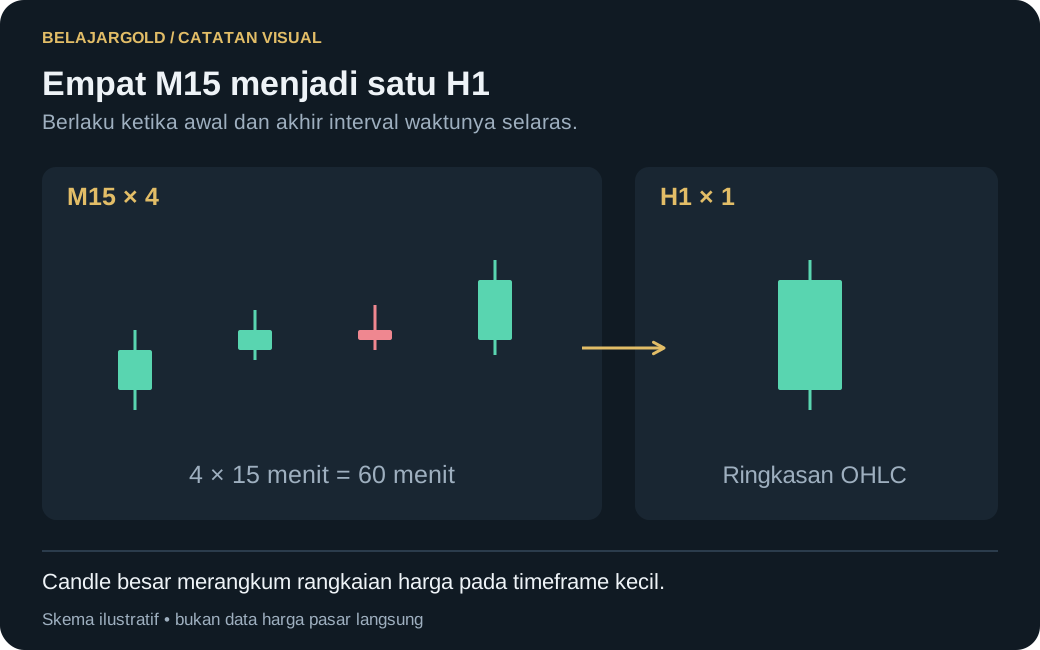
Common timeframes
- Higher (D1, H4): the big picture, the main direction, key levels.
- Middle (H1, M30): building scenarios and entry areas.
- Lower (M15, M5): more precise entry timing.
Multi-timeframe
A common approach: set your bias on a higher timeframe, then look for entries on a lower timeframe in the same direction as that bias. Analyzing a single timeframe alone is easily misleading.
Chart types
- Candlestick — the most informative; shows open, high, low, and close. Covered in depth in Module 6.
- Line — closing prices only; useful for seeing the overall shape.
Key points
- There is no "best" timeframe — only one that fits your style and the time you have available.
- Always confirm direction on a higher timeframe.
Disclaimer risiko: seluruh konten di situs ini disediakan untuk tujuan edukasi, bukan nasihat keuangan, sinyal, ajakan transaksi, atau janji keuntungan. Trading memiliki risiko tinggi dan dapat menyebabkan kehilangan sebagian atau seluruh modal. Pelajari legalitas penyedia layanan sesuai yurisdiksi Anda.